Introduction
In Biology circles one frequently hears that the United States is more anti-evolution than most other developed countries. Is it really true? Most such claims cite as evidence a 2006 paper by Jon Miller, Eugenie Scott and Shinji Okamoto (Miller et al. 2006), who analyzed amalgamated data from surveys given to citizens of U.S. and other developed countries. (These countries were Austria, Belgium, Bulargia, Croatia, Cyprus, Czech Republic, Denmark, Estonia, Finland, France, Germany, Greece, Hungary, Iceland, Ireland, Italy, Japan, Latvia, Lithuania, Luxembourg, Malta, Netherlands, Norway, Poland, Portugal, Romania, Sloviakia, Slovenia, Spain, Sweden, Switzerland, Turkey, United Kingdom and the United States.) All surveys asked participants to evaluate the statement, “Human beings, as we know them, developed from earlier species of animals.” Respondents could answer “true,” “false,” or “I am not sure or I don’t know.” It’s important to note that this question gets at belief in human evolution, not evolution in general.
Miller et al. (2006) found that, in the United States, the level of uncertainty regarding human evolution seems to have increased over the last two decades. Specifically, the proportions of U.S. respondents who consider the statement true and those who think it is false both decreased. In 1985, 45% of U.S. citizens marked the statement true, while 48% said it was false. By 2006 these fractions both dropped to 40% and 39%, respectively, while the fraction who checked “I am not sure or I don’t know” increased from 7% to 21%. Compared to these data from the U.S., the other countries surveyed, with one exception, were much more accepting of the concept that humans evolved. The exception is Turkey.
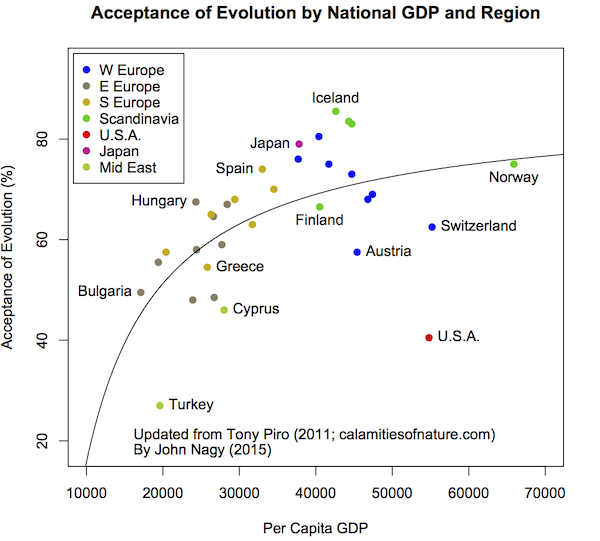
Figure 1. Acceptance of human evolution by national per capita Gross Domestic Product (GDP). Acceptance of evolution is the percentage of people who answered, “true” to the question, “Human beings, as we know them, developed from earlier species of animals” as reported by Miller et al. (2006). Per capita GDP data are CIA’s 2014 estimate as reported in their World Factbook. Basic format and classification by region follows Piro (2011). Curve is least-squares best fit of the data, exclusive of the U.S., to the function, E = A(1-B/x), where E is Acceptance of Evolution and x is Per Capita GDP. Only selected nations are labeled.
This result was visualized by Tony Piro in a very amusing way. In 2011 he plotted acceptance of human evolution by standardized per capita Gross Domestic Product, or GDP, which measures a country’s annual production of goods and services. Figure 1 replots Piro’s graph using up-to-date data from the same sources he used (Miller et al. 2006 and the CIA’s World Factbook). The U.S. is indeed an outlier. If one ignores that for a moment, these data also suggest that acceptance of human evolution increases with GDP. That’s not to say that higher GDP directly causes more people to accept evolution; rather, GDP probably covaries with something that does, like education. Indeed, a number of studies have shown that, even in the U.S., more highly educated people are more likely to accept human evolution and evolution in general (see the 2013 and 2014 Pew and Gallup polls, respectively and, e.g., Paz-y-Miño and Espinosa 2009). GDP does correlate with educational expenditure,1 and a plot of the Miller et al. data against education expenditures in each country shows a very clear, statistically significant2 relationship (Fig. 2). Again, the U.S. and Turkey are outliers. Acceptance of evolution in the U.S. sits well below that of countries with similar investments in education, which includes all western European nations surveyed. Although Turkey boasts the smallest per capita investment in education, a much smaller proportion of its population accepts evolution than in Bulgaria and Romania, which invest only slightly more in education.
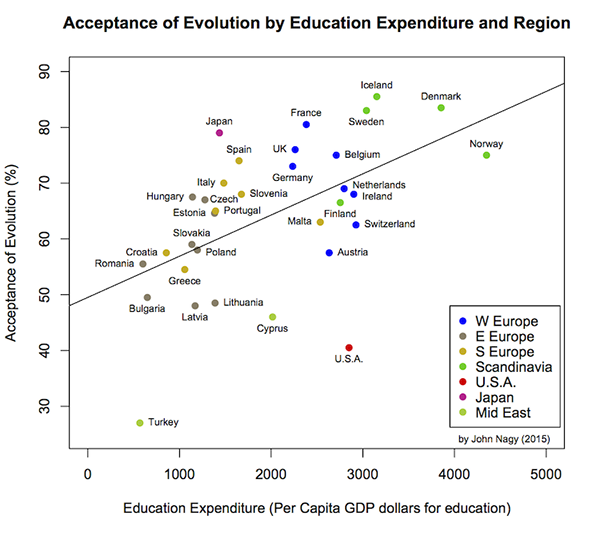
Figure 2. Acceptance of human evolution by national education expenditure and region. Education expenditure is the product of national GDP and the percentage of GDP devoted to education, both as reported by CIA’s World Factbook. Regional classification follows Piro (2011). Least-squares regression line is shown.
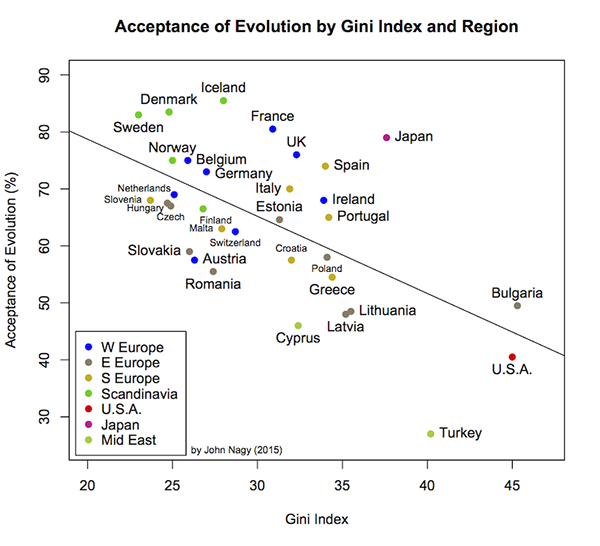
Figure 3. Acceptance of human evolution by wealth disparity (Gini index) and region. Gini index data comes from CIA’s World Factbook. Regional classification follows Piro (2011). Least-squares regression line is shown.
Miller et al. took an evidence-based approach to identify why U.S. citizens dismiss human evolution so much more than do their peers in other countries. In addition to the education component, they find evidence for two other causal factors: fundamentalist religion, which is rare in Europe but more common in the U.S. (and Turkey), and politics. This latter point may help explain an interesting pattern that emerges when one plots acceptance of evolution versus Gini index, which is a measure of income disparity in a country. The CIA World Factbook gives Gini indexes for all countries in the Miller et al. study. The CIA scales the index so that it runs from 0 to 100. A perfectly egalitarian country, in which all citizens had precisely the same amount of wealth, would have a Gini index of 0, while a country in which all the wealth were concentrated in a single household would have a Gini index (essentially) of 100. In general, the higher the index, the more unequally a country’s wealth is distributed among its citizens, roughly speaking. By this measure, the U.S. is again an outlier, with much more economic disparity than all other country surveyed except Bulgaria. Interestingly, acceptance of evolution correlates negatively with Gini index (Fig. 3). In other words, a smaller proportion of people accept human evolution as income disparity increases. This does not mean that economic equality causes people to believe in evolution, just that it correlates with something that does. Again, education is probably involved. More egalitarian societies tend to spend more per capita on education.4 However, the complete explanation probably involves a complex interaction among inequality, education access, religious fundamentalism and power politics.
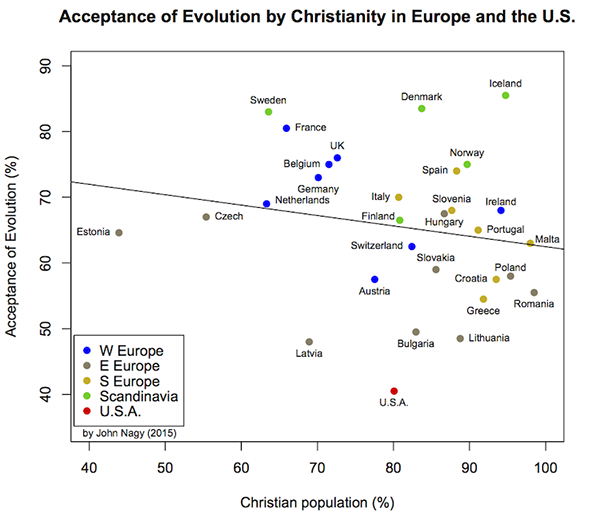
Figure 4. Acceptance of evolution by fraction of the population identifying themselves as Christian in Europe and the United States. Religion data comes from the Association of Religious Data Archives. Regional classification follows Piro (2011). Least-squares regression line is shown.
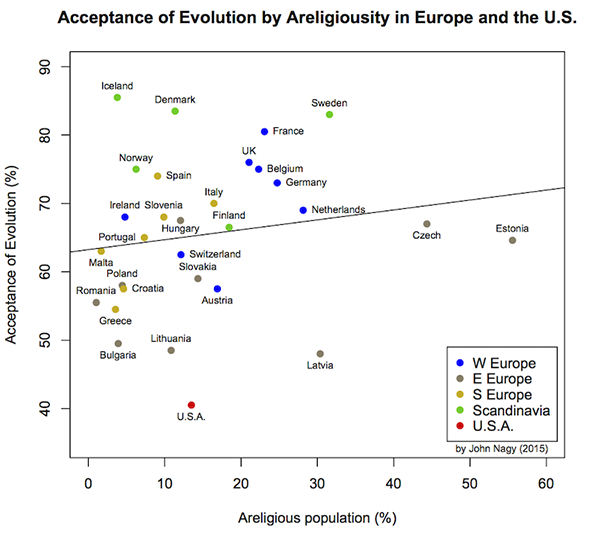
Figure 5. Acceptance of evolution by fraction of the population identifying themselves as areligious (agnostic or atheist) in Europe and the United States. Religion data comes from the Association of Religious Data Archives. Regional classification follows Piro (2011). Least-squares regression line is shown.
In the U.S., evolution is often framed as a fundamental conflict between science and Christianity. This conclusion is not supported by international comparisons. No obvious correlation exists between a country’s acceptance of human evolution and the proportion of its population that is Christian, or conversely areligious (agnostic or atheist; Figs. 4 and 5). To simplify matters, in this analysis I only compare the U.S. to European countries. It is clear from Figures 4 and 5 that religiosity in the U.S. is unremarkable compared to Europe, at least based on the proportion of its population that are Christian (and therefore proportion that are areligious, since most people in these countries who are not Christians are areligious (ARDA).) Finally, the U.S. is not an outlier. Two eastern European countries, Estonia and the Czech Republic, take that role, being considerably less religious than the others. These observations—specifically the lack of a relationship between these crude measures of religiosity and acceptance of evolution—fit the conclusions of Miller et al. They found that fundamentalism, not Christianity per se, is a key factor determining acceptance of evolution. In comparison, the only other country surveyed that accepts human evolution less than the U.S. does–Turkey–is deeply religious but hardly Christian. (Turkey’s population is 98.3% Muslim, 1.03% agnostic, 0.27% Christian, 0.18% neoreligionist, 0.08% atheist and 0.14% other according to the Association of Religion Data Archives).
Methods and Analysis
1. Data sources. Here I always report level of belief in human evolution as the percent of people in a country who marked that the following statement is true: “Human beings, as we know them, developed from earlier species of animals.” National data include only those reported by Miller et al. (2006), but Luxembourg has been excluded because it is an outlier in many ways, and I could not obtain consistent values for the other variables measured. National Gross Domestic Product (GDP), Gini index and education expenditure data come from CIA’s World Factbook Country Profiles, and are always the most recent data reported (as of June 27, 2015). GDP is reported in U.S. dollars standardized for purchasing power within each country. Gini index is reported as a percentage (essentially the area between the Lorenz curve and the ideal equality curve as a percentage of the area under the ideal equality curve). CIA reports educational expenditure as proportion of GDP. Here I multiply this by per capita GDP to obtain the measure of investment in education (in standardized GDP dollars per person per year). All data on religious affiliation in each country comes from the Association of Religious Data Archives’ National Profiles.
2. Evolution and GDP. Figure 1 follows Piro (2011), but uses updated GDP data. Following Piro, I fit a hyperbola to the data using R’s nonlinear fitting function, “nls.” The curve plotted is the least-squares best fit of the equation, y = A(1-B/x), where y is acceptance of human evolution, x is per capita GDP, with parameters A=86.72545 and B=8171.943. The U.S. was excluded from the fit.
3. Evolution, Gini index, education investment and religiousity. In order to keep things simple for this essay, I analyze the data in a very straightforward, although overly conservative, way. In the technique I’m using we lose information about covariance. (For example, if x correlates with y, and y correlates with z, then x would correlate with z even if x and z have nothing directly to do with each other.) Luckily, the main patterns are so clear that fancier techniques don’t add much (except in one instance, which I’ll explain below.) For those with less statistical background, skip to the last subsection. My main study here is a multiple regression of acceptance of evolution on Gini index, education investment and religiousity. I have measure religiousity in two ways: percentage of the population that is Christian and percentage that is areligious (agnostic or atheist). These two measures strongly covary because in the countries analyzed most people who are not Christian are areligious. So, again in the spirit of simplicity, we only look at one of the two, namely percent that are Christian. That gives us regressions of acceptance of evolution against three different variables. We use the admittedly crude Bonferroni correction to control studywise significance. That is, if we were to adopt a significance threshold α = 0.05 for the study, then the significance threshold for any of the 3 regressions would be 0.05/3 ≈ 0.016667. (That is, we wouldn’t call any of the regressions “significant” unless p < 0.016667 for a given regression.)
(a) Evolution by educational investment. The regression slope coefficient is “significantly” different from zero (p = 0.00132). If viewed as a correlation, the (significant) adjusted r2 = 0.2637; that is, about 26% of the variance in acceptance of evolution is explained by the regression on education expenditure.
(b) Evolution by Gini index. Again, the regression slope coefficient is significantly different from zero (p = 3.17 × 10⁻⁴). Adjusted r2 = 0.325. This relationship is stronger than can be explained by the covariance between Gini index and education investment, although this crude analysis can’t really show that. Nevertheless, there seems to be an additional, unmeasured factor involved. It may be related to power politics, as suggested by Miller et al.’s results.
(c) Evolution by Christianity. Here, the regression slope coefficient is not significantly different from zero (p = 0.321). Adjusted r2 is not distinguishable from zero. No obvious relationship exists between these variables.
(d) Summary for the less-statistically inclined. In Figures 2, 3 and 4 we are looking to see if the data reveals relationships between the variables on each plot. As with all real-world data, the points look “spread out” because of random (unpredictable) variation. For example, suppose, for the sake of argument, that education investment effectively increases acceptance of evolution. The data in Figure 2 would still reflect randomness; e.g., by accident a sample from one country might capture a disproportionate number of hard-core evolutionists, and (or) nations spending the same amount per capita on education won’t invest the money in precisely the same ways. That variation can obscure the true pattern.
A second problem arises because human brains tend to make patterns out of nothing. (Hence, all the rich casino owners in Las Vegas.) Imagine shooting a piece of paper with a shotgun and then tracing the holes onto graph paper. Make it nice and fancy, draw axes and then show it to a bunch of random people. If you ask them to identify a pattern, they will typically come up with something that, to them anyway, is meaningful despite the fact that the pattern is entirely random. (This behavior is confirmed by a number of psychology experiments.) We need an objective way to identify patterns so our brains don’t fool us. Regression (and correlation) provide that objectivity. Speaking roughly, regression fits a line to the data that minimizes the collective deviation of all points from the line. The process will always produce such a line (and that line is unique) whether there is a relationship between the variables or not. Even “shotgun blasts” typically generate lines with a noticeable slope, making it appear as if a relationship exists between the two variables. So far, regression acts like the human brain. But in addition to supplying the line, regression also calculates the probability that a random shotgun blast would, by pure chance, appear to show a relationship at least as strong as the one you’re looking at in your data. That probability is called a p-value. If that p-value is large, then the apparent relationship in your data could easily be caused by pure chance. On the other hand, small p implies that something more than just chance is operating.
In this analysis, the regression slopes for both educational investment (Fig. 2) and economic disparity (Fig. 3) were unlikely to be caused by chance. You would have to blast away with your shotgun more than 750 times, on average, to randomly generate the relationship between education investment and acceptance of evolution once. For the economic disparity data, buy more ammo–more than 3100 shots, on average, would be needed to get a relationship at least that strong by chance. On the other hand, there is nothing obvious besides chance acting on the relationship between acceptance of evolution and Christianity of a given country. A shotgun would produce a relationship at least as strong as the one in Figure 4 about once every three shots, on average.
1Data not shown, but the correlation between standardized GDP and education expenditures as a fraction of GDP, as listed in the World Factbook, is significantly positive (p = 0.00149) with a raw r2 = 0.2851.
2See statistical analysis at the end of the essay.
3The correlation between Gini index and educational expenditure, measured as percent of GDP spent on education times per capita GDP, is “significant” if one does not attempt to control study-wise error (uncorrected p=0.0174), although it would not reach the significance threshold if we use the Bonferroni correction for the entire study. Admittedly, this would be quite conservative, and we should pay some attention to the amount of variance explained by the regression (unadjusted r2 = 0.1693).
References
ARDA. Association of Religious Data Archives, National Profiles. www.thearda.com, June 2015.
CIA. World Factbook, Country Profiles. www.cia.gov/the-world-factbook/, June 2015.
Gallup. In U.S., 42% believe creationist view of human origins: Americans’ views related to religiousness, age, education. www.gallup.com/poll/170822/believe-creationist-view-human-origins.aspx, May 2015.
Miller, J.D., E.C. Scott and S. Okamoto. 2006. Public acceptance of evolution. Science 313: 765-766.
Paz-y-Miño, G. and A. Espinosa. 2009. Acceptance of evolution increases with student academic level: A comparison between a secular and a religious college. Evolution (N.Y.) 2(4): 655-675.
Pew Research Center. Public’s views on human evolution. www.pewforum.org/2013/12/30/publics-view-on-human-evolution, December 2013.
Piro, T. Belief in evolution vs. national wealth: Calamities of nature. www.calamitiesofnature.com/archive/?c=559, July 2011.