The Global Carbon Cycle
Figure 1: The center diagram shows how carbon moves between the land, atmosphere and oceans. Yellow numbers indicate natural fluxes, white are stored carbon, and red representes human contributions in gigtons per year.
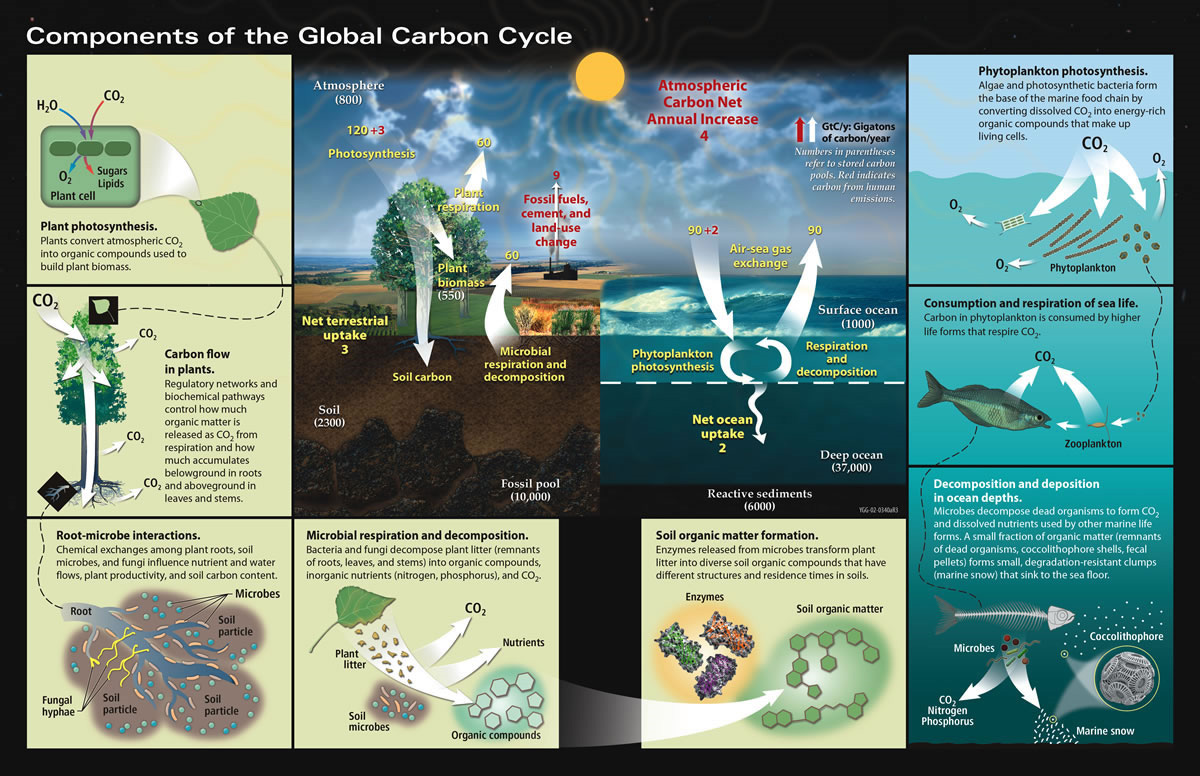
U.S. D.O.E. 2008 Carbon Cycling and Biosequestratoin: Report from the March 2008 Workshop, DOE/SC-108, U.S. Department of Energy Office of Science. (p. 2-3)
Table 1: How the ocean is experiencing stress from the lack of reduced greenhouse gas emissions.
| Stressor |
Causes |
Result |
Direct Effects |
Impacts |
|
Acidification
Developed as a research topic in past decade
|
- Increasing atmospheric carbon dioxide emissions
- Coastal nutrient enrichment, methane hydrates and acid gases from industrial emissions may also contribute locally, increasing variability
|
- Unprecedented rapid change to ocean carbonate chemistry
- Much of the ocean will become corrosive to shelled animals and corals, with effects starting in the Arctic by 2020
|
- Reduced calcification, growth and reproduction rates in many species
- Changes to the carbon and nitrogen composition of organic material
- Dissolution of unprotected calcium carbonate
structures in some regions
|
- Impeded shell or skeletal growth and physiological stress in many species, including juvenile stages
- Change to biodiversity and ecosystems, and the goods and services they provide
- Cold and upwelling waters currently supporting key fisheries and aquaculture likely to be especially vulnerable
|
|
Warming
A relatively mature study area in terms of physical changes and physiology but poorly studied at ecosvstem and biogeochemical levels
|
- Increasing greenhouse gas emissions to the atmosphere
|
- Temperature increase,
particularly in near-surface waters
- Less ocean mixing due to increased stratification
- Increased run-off and and sea-ice melt will also contribute to stratification in Arctic waters
- Increased in marine heat waves
|
- Decreased carbon dioxide solubility
- Increased speed of chemical and biological processes
- Reduced natural nutrient re-supply in more stratified waters
|
- Stress to organism physiology, including coral bleaching
- Extensive migration of species
- More rapid turnover of organic
matter
- Nutrient stress for
phytoplankton, particularly in warm waters
- Changes to biodiversity, food webs and productivity, with potential consequences for fisheries, coastal protection and tourism
|
|
Deoxygenation
Emerging issue, poorly studied
|
- Reduced oxygen solubility due to warming
- Decreased oxygen supply to the ocean interior due to less mixing
- Nutrient rich land run-off stimulating oxygen removal locally
|
- Less oxygen available for respiration especially in productive regions, and in the ocean interior
- Extended areas of low and very low oxygen (dead zones)
|
- Reduced growth and activity of zooplankton, fish and other oxygen-using organisms
- Endocrine disruption
|
- Stress to oxygen-using organisms
- Risk of species loss in low oxygen areas
- Impacts on reproductive success
- Shift to low oxygen-tolerant organisms, especially microorganisms and loss of ecosystem services in these areas
|
|
Sea Level Rise
A mature research area and a long-term issue
|
- Climate warming due to increased greenhouse gas emissions to the atmosphere
|
- Melting of glaciers and ice sheets
- Thermal expansion of seawater
|
- Increase in the volume of water in the ocean
- Rise in the level of seas
|
- Flooding of coastal and island habitats
- Erosion of shorelines , Loss of infrastructure
- Greater risk of impacts from storms and surges
|
Turley C, Keier I, Seeyave S, Beckman F, Waddicombe S: Oceans of Impact. Plymouth Marine Laboratory, Partnership for Observation of the Global Oceans, Global Ocean Acidification-Observinf Network, Ocean Acidification – International Coordination Center; 2018 4pp. DOI: 10.17031/EP387W.
Green Apps
Download the following apps on your phone to track your positive impacts today.
Track your Carbon Footprint:
- LiveGreen Daily Carbon Tracker
- EcoCRED: Eco-Focused Habits
Measure Air Quality in your area:
- Plume Air Report: Pollution
Others:
- iRecycle: Locate places to recycle specific items including brake fluid, batteries, paint and so much more!
- Seafood Watch: Make sure the seafood you eat is the best choice whether it is fished or farmed while also seeing which seafood to avoid! Locate nearby seafood & sushi!